Crypto analysis: Cardano (ADA) and Binance (BNB) chart analysis
Cryptocurrency chart analysis: Cardano (ADA) and Binance (BNB) price analysis
 |
| ADA and BNB cryptocurrency chart analysis |
Cardano price chart analysis:
Cardano's price went into a pause after reaching a local high at $0.647. Even though it tried to go higher at $0.680, the upward momentum didn't support it. Now, ADA is moving sideways and is currently trading at $0.608.
However, ADA has been making higher low points, showing that people keep buying when the price goes down. In the short term, Cardano's price might break the trend line connecting the higher lows since December 8. This could briefly go below the weekly support level at $0.567 and try to touch the equal lows around $0.541.
 |
| Cardano (ADA) chart analysis |
This 11% drop in Cardano's price is a good opportunity for people who were waiting on the sidelines to buy ADA at a lower price. It might also make those who bet on the price going down (short-sellers) close their positions. These two events can lead to a sudden increase in buying, causing a recovery that helps Cardano reclaim the support level at $0.622.
In a very positive scenario, if Cardano's price can go past the $0.600 to $0.650 range, it could keep going up and try to repeat the 55% increase seen between December 7 and 13. This could mean ADA going up by 35%, from the weekly support level of $0.567 to reach the obstacles at $0.800 and $0.823.
On the flip side, if Cardano's price turns the $0.567 support
into a resistance on the weekly timeframe, it might show weakness. This would
also create a lower low, going against the positive expectations. In this
situation, Cardano's price could drop by 25% and touch the $0.400 support
level.
Read more:
Crypto analysis: XRP (Ripple) and Ethereum chart analysis
 |
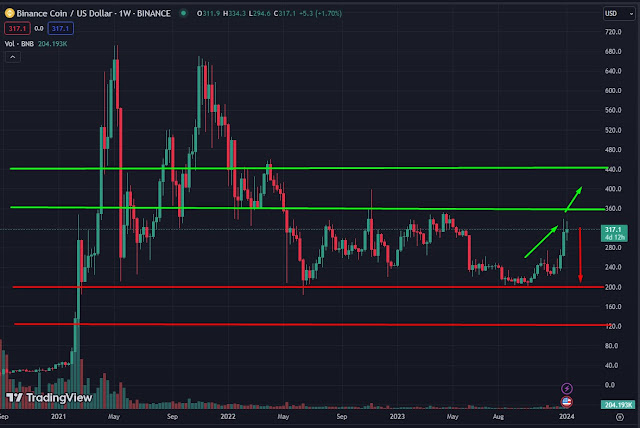
BNB price chart analysis:
The Binance Coin's price movement since Christmas, on December 25, has formed a flag pattern, which is like a signal that the trend will continue. This pattern happens after a short pause in a trend, and there's a good chance that the price will keep going up, following the existing trend.
A flag pattern typically occurs when there's a strong upward movement, shown by big candles, followed by a small downward movement, shown by smaller candles. To figure out where the price might go, you can measure the "flagpole" of the pattern and expect the price to increase by a similar amount from the breakout point.
 |
| Binance (BNB) chart analysis |
In this case, from December 25 to December 28, the flagpole showed a 29.03% increase. If this pattern continues, the Binance Coin's price could go up by the same percentage, reaching a value of $414.70. This, of course, depends on the Binance Coin's price breaking above the upper boundary of the flag, which would mean more people buying it.
Some indicators support this idea. The Bollinger Bands indicator shows that the Binance Coin's price is above the centerline, providing strong support at $279.70. The Parabolic Stop and Reverse (SAR) also support this, adding another support layer at $301.10.
Moreover, both the Awesome Oscillator (AO) and the Moving Average Convergence Divergence (MACD) indicators are in positive territory, supporting the idea that the price will keep going up. The MACD is above the signal line, showing that there is still potential for an increase.
However, there are some warning signs. The Relative Strength Index (RSI) has just crossed below the signal line, which is often seen as a signal to sell. The red bars on the Awesome Oscillator (AO) also suggest a potential correction.
If the bears (sellers) take control, the Binance Coin's price could go down, breaking below the lower boundary of the flag and testing the Parabolic SAR at $301.10. If the price closes below this level for a whole day, it could mean that the positive outlook is no longer valid.
In a worst-case scenario, the price could drop below the centerline at $279.90, or even test the lowest point of the flag at $262.30, which was last seen on Christmas day.


Post a Comment
0 Comments